MTC Chennai's E-Bus Transition: Financial, Environmental & Social Impacts
An interactive dashboard providing a comprehensive analysis of Chennai's shift to electric buses under the Gross Cost Contract (GCC) model. Explore the financial viability, environmental benefits, and social justice considerations, highlighting a strategically sound initiative backed by robust government support.
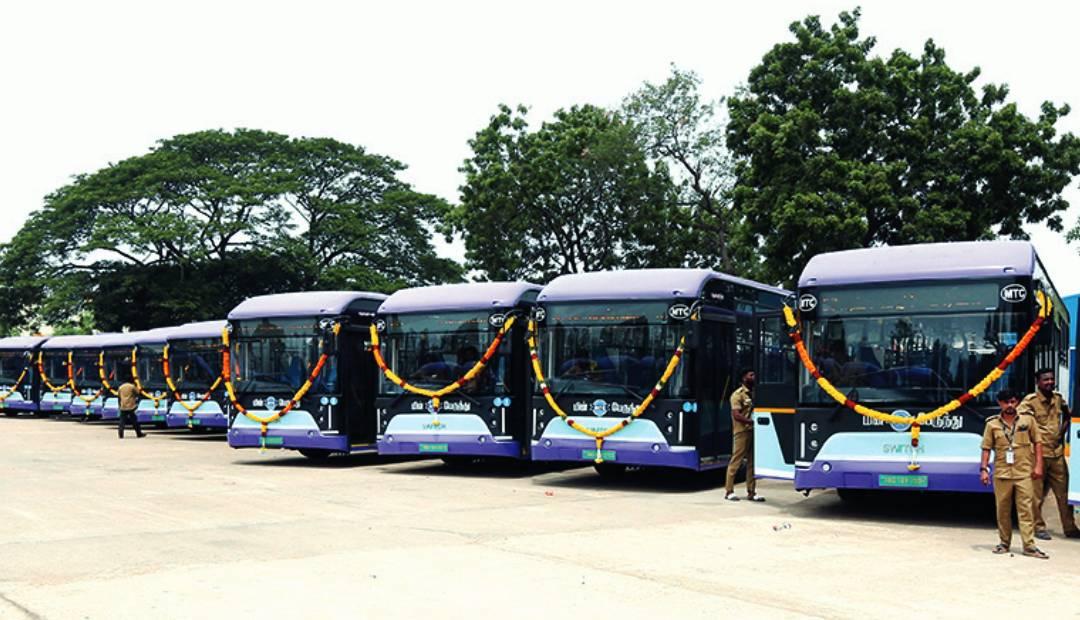
Electric bus launched in Chennai. (Image source: Mathrubhumi.com)
What you'll find on this dashboard:
- Key financial metrics at a glance for Chennai's e-bus project.
- An explanation of the Gross Cost Contract (GCC) model and its stakeholders.
- Detailed cost-benefit analysis and operational comparisons.
- An interactive simulator to explore financial sensitivities.
- Long-term financial outlook and the multi-layered funding ecosystem.
- An emissions calculator to visualize environmental impact.
- An analysis of social justice impacts, including free travel access and potential employment changes.
The Gross Cost Contract (GCC) Model
The GCC model is the financial backbone of Chennai's e-bus strategy. It defines a clear partnership where private operators handle fleet ownership and operations, while the MTC manages routes and revenues. This structure transfers key risks to the private sector and ensures predictable costs for the public authority.
Government & Funders
Provide funding (VGF, loans) to enable the project and secure payments.
Private Operator
Procures, owns, operates, and maintains the buses and charging infra.
MTC (Public Authority)
Defines routes, collects all fare revenue, and manages service schedules.
Key Financial Flows in the GCC Model:
1. Funding & Support
Central and State Governments, along with International Financial Institutions, provide crucial funding (e.g., Viability Gap Funding, loans) to MTC and the project, reducing financial burden and de-risking investments for operators.
2. Operator's Service Provision
Private operators invest in, own, operate, and maintain the electric bus fleet, including providing drivers and charging infrastructure, ensuring high-quality service delivery.
3. MTC's Revenue Collection & Payout
MTC collects all fare revenue from passengers and manages routes. In turn, MTC pays the private operator a fixed per-kilometer rate for the services rendered, guaranteeing predictable income for the operator.
4. Risk Transfer
The GCC model transfers key operational risks (e.g., fuel price volatility, maintenance costs) from MTC to the private operator, allowing MTC to focus on public service delivery.
Cost-Benefit Analysis
A core component of the financial model is comparing costs. While e-buses have a higher upfront procurement cost, their operational costs are significantly lower than diesel buses. The GCC rates paid by MTC are structured to cover the operator's full lifecycle costs, including capital recovery and profit.
E-Bus Procurement Cost
Operational Cost Comparison (per km)
Interactive Financial Simulator
How do different factors affect MTC's daily and yearly financials? Use the sliders below to adjust key operational variables and the number of buses, then see the real-time impact on revenue, operator payout, and the resulting profit or loss. This demonstrates the financial sensitivities of the model.
MTC's Simulated Financials
MTC Yearly Net Result (before VGF)
Calculating...
(This deficit is covered by State Government's VGF)
Estimated Annual Tax Burden per Person (for VGF):
₹0
(Based on current simulated deficit and TN population)
Long-Term Outlook & Funding
The financial viability of the e-bus project extends over a 12-year contract. While MTC faces a daily operational deficit covered by the government, operators see a substantial revenue stream. The project's long-term profitability is further bolstered by the declining cost of batteries, a key component.
Total Contract Extrapolation (12 Years, 1,225 Buses)
Projected Battery Price Decline (per kWh)
Multi-Layered Funding Ecosystem
Central Government
PM e-Bus Sewa, FAME-II incentives, and a crucial Payment Security Mechanism (PSM) to de-risk projects for operators.
International Financial Institutions
Major loans and support from the World Bank, Asian Infrastructure Investment Bank (AIIB), and Germany's KfW bank.
State Government
Provides direct Viability Gap Funding (VGF) to MTC, covering the operational deficit and ensuring the service remains financially sustainable.
Emissions & Environmental Impact
Calculate the positive environmental impact of transitioning from diesel to electric buses. See how many tons of CO2 are avoided and what that means in real-world equivalents.
Estimated Annual Impact
Avoided CO2 Emissions:
0 tons
Equivalent to Trees Planted:
0 trees
Equivalent to Homes Powered:
0 homes
Social Justice Impacts
The transition to e-buses, while beneficial environmentally, also raises important social justice considerations, particularly regarding free travel access and employment reservation policies.
Free Travel Access
Chennai's MTC offers free travel for women on ordinary services (Vidiyal Payanam scheme), benefiting 13.5 lakh women daily. However, all new e-buses operate as deluxe services and are *not* part of this free scheme, meaning passengers, including women, must pay the deluxe fare.
Potential Annual Cost Burden (if all deluxe passengers previously traveled free):
₹0 Crore
Employment & Reservations
Under the GCC model, private operators are responsible for employment. Unlike state-owned transport undertakings, private companies may not be legally bound by the same reservation policies (e.g., for scheduled castes/tribes, backward classes, or women) in their hiring practices. This shift could potentially impact employment opportunities for specific demographic groups that traditionally benefit from government reservation policies. Further research is needed to quantify this impact.
Average Differential Earnings (Government vs. Private)
This calculator estimates the potential annual loss of earnings for staff if government-hired positions are replaced by private operator employment, assuming different salary structures.
Total Estimated Annual Earnings Loss:
₹0 Crore